Graph vs Chart: A Comparative Study with Examples
Understanding Graphs
Graphs are used to display data points and their relationship on a plot. They connect the data points, making trends and patterns more visible.
Graphs are particularly useful when you want to show changes over time; for example, tracking a company's stock prices, or monitoring the temperature over seasons. They can help in identifying trends, such as whether the temperature increases or decreases over time.
Types of Graphs
- Line Graph: Connects consecutive points with straight segments, illustrating changes over time.
- Scatter Plot: Displays two sets of data by plotting coordinate pairs on a grid, ideal for showing the correlation between two variables.
Graph Examples
Let's consider line and scatter graphs.


A line graph can display monthly rainfall over a year, while a scatter plot can illustrate the relationship between people's heights and weights.
Understanding Charts
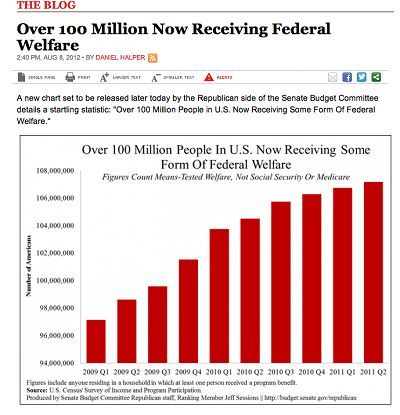
Charts, on the other hand, use bars, circles, or other shapes to compare discrete categories of data.


Charts are handy when you want to compare categories, like comparing sales figures across different regions, or displaying the favorite foods of different age groups. They're excellent for showing differences, comparisons, and even showing lots of data in a small space.
Types of Charts
- Bar Chart: Uses bars (horizontal or vertical) to show comparisons and are often used to display flat or constrained data.
- Pie Chart: Divides a circle into sectors, representing numerical percentages.
Chart Examples
A bar chart can clearly display the population of different countries, while a pie chart can illustrate the proportion of different types of trees in a forest.
Choosing Between Graphs and Charts
The choice between graphs and charts primarily depends on the type of data and the information you want to convey.


Describe changes over time or want to show a continuous relationship? Use graphs. Want to compare categories, display differences, or show lots of data in a small space? Charts are your go-to.
Remember, the goal is to make your data accessible and engaging. Choosing the right visualization can make complex data easy to understand and navigate. Like a good storyteller, you want your audience to follow your data and draw meaningful insights.
And so, your data visualization journey begins. Happy graphing and charting!

Related Articles

"Grade 6 Tessellation Pattern Examples with Answers"
Tessellations, a fascinating topic in geometry, are repeating patterns formed by fitting shapes together without overlapping or leaving gaps. They are not only...

Matrix Multiplication Examples with Solutions
Matrix multiplication is a fundamental operation in linear algebra, enabling the combination of linear transformations. It's used extensively in machine...

Signature vs. Autograph: Key Differences with Examples
**Symbol of Distinction: Signature vs. Autograph - A Detailed Comparison** Millennia-old traditions, signatures and autographs both bear witness to our...

What is a Vector with Examples
In the dynamic world of mathematics and science, you'll often encounter the term "vector". But what is a vector, and how is it different from regular numbers?...

Mastering Line Graphs: Easy-to-understand Examples
Line graphs are a powerful and widely-used tool in data visualization, helping us understand trends, track changes, and compare data sets. However, creating...

Pedigree Chart Calculator: Trace Your Ancestry with Ease
A pedigree chart calculator is an essential tool for those tracing their genealogy or planning a family tree. This interactive device helps you create, modify...